[vc_row][vc_column][vc_empty_space height=”40″][trx_title type=”3″ style=”underline” color=”#a06921″]Major Crime Statistics[/trx_title][vc_column_text]
Jan-Mar 2021 Compared to Same Period in Prior Years
[/vc_column_text][vc_empty_space height=”32″][vc_row_inner][vc_column_inner width=”1/2″][vc_column_text]
Overall Crime
[/vc_column_text][cq_vc_modal buttontext=”JTNDaW1nJTIwY2xhc3MlM0QlMjJhbGlnbnJpZ2h0JTIwc2l6ZS1mdWxsJTIwd3AtaW1hZ2UtMTc4MSUyMiUyMHNyYyUzRCUyMmh0dHBzJTNBJTJGJTJGbWVtcGhpc2NyaW1lLm9yZyUyRndwLWNvbnRlbnQlMkZ1cGxvYWRzJTJGMjAyMSUyRjA3JTJGb3ZlcmFsbC1jcmltZS01LXJlc2l6ZS5qcGclMjIlMjBhbHQlM0QlMjIlMjIlMjB3aWR0aCUzRCUyMjEwMjQlMjIlMjBoZWlnaHQlM0QlMjI2MDAlMjIlMjAlMkYlM0U=” textcolor=”#333333″ background=”#ffffff”]Overall Crime
(Incidents per 100,000 population)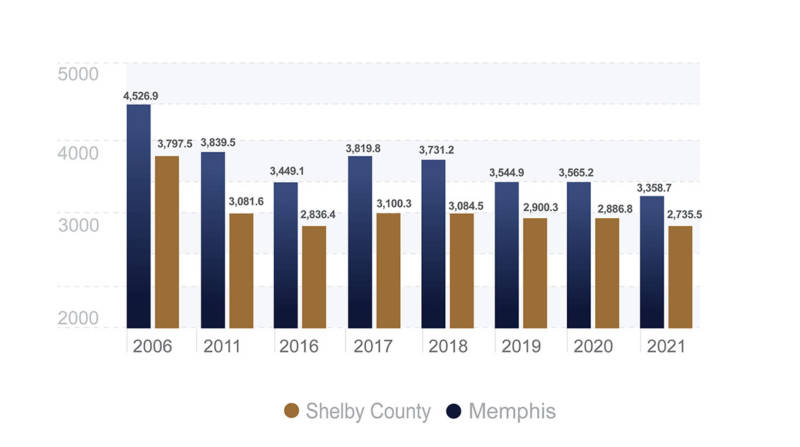 [/cq_vc_modal][/vc_column_inner][vc_column_inner width=”1/2″][vc_column_text]
Major Violent Crime
[/vc_column_text][cq_vc_modal buttontext=”JTNDaW1nJTIwY2xhc3MlM0QlMjJhbGlnbnJpZ2h0JTIwc2l6ZS1mdWxsJTIwd3AtaW1hZ2UtMTc4MCUyMiUyMHNyYyUzRCUyMmh0dHBzJTNBJTJGJTJGbWVtcGhpc2NyaW1lLm9yZyUyRndwLWNvbnRlbnQlMkZ1cGxvYWRzJTJGMjAyMSUyRjA3JTJGbWFqb3ItdmlvbGVuY2UtNS1yZXNpemUuanBnJTIyJTIwYWx0JTNEJTIyJTIyJTIwd2lkdGglM0QlMjIxMDI0JTIyJTIwaGVpZ2h0JTNEJTIyNjAwJTIyJTIwJTJGJTNFJTBBJTBB” textcolor=”#333333″ background=”#ffffff”]Major Violent Crime
(Incidents per 100,000 population)
 [/cq_vc_modal][/vc_column_inner][/vc_row_inner][vc_row_inner][vc_column_inner width=”1/2″][vc_column_text]
[/vc_column_text][/vc_column_inner][vc_column_inner width=”1/2″][vc_column_text]
[/vc_column_text][/vc_column_inner][vc_column_inner][vc_empty_space][/vc_column_inner][/vc_row_inner][vc_row_inner][vc_column_inner width=”1/4″][/vc_column_inner][vc_column_inner width=”1/2″][vc_empty_space][vc_column_text]
Major Property Crime
[/vc_column_text][cq_vc_modal buttontext=”JTNDaW1nJTIwY2xhc3MlM0QlMjJhbGlnbnJpZ2h0JTIwc2l6ZS1mdWxsJTIwd3AtaW1hZ2UtMTc3OSUyMiUyMHNyYyUzRCUyMmh0dHBzJTNBJTJGJTJGbWVtcGhpc2NyaW1lLm9yZyUyRndwLWNvbnRlbnQlMkZ1cGxvYWRzJTJGMjAyMSUyRjA3JTJGbWFqb3ItcHJvcGVydHktNS1yZXNpemUuanBnJTIyJTIwYWx0JTNEJTIyJTIyJTIwd2lkdGglM0QlMjIxMDI0JTIyJTIwaGVpZ2h0JTNEJTIyNjAwJTIyJTIwJTJGJTNF” textcolor=”#333333″ background=”#ffffff”]Major Property Crime
(Incidents per 100,000 population)
 [/cq_vc_modal][/vc_column_inner][vc_column_inner width=”1/4″][/vc_column_inner][/vc_row_inner][/vc_column][/vc_row][vc_row inverse=”” el_class=”stats-trends” css=”.vc_custom_1576878966303{border-radius: 2px !important;}”][vc_column width=”1/4″ css=”.vc_custom_1625161740653{border-right-width: 0px !important;}”][/vc_column][vc_column width=”1/2″][vc_column_text]
[/vc_column_text][/vc_column][vc_column width=”1/4″][/vc_column][/vc_row][vc_row][vc_column][vc_empty_space height=”60px”][trx_title type=”3″ style=”underline” color=”#a06921″]Safe Community Plan Metrics[/trx_title][vc_column_text]
Jan-Mar 2021 Compared to Same Period in Prior Years
[/vc_column_text][vc_empty_space][vc_row_inner][vc_column_inner width=”1/3″][vc_column_text]
Gun Related Violent Incidents
[/vc_column_text][cq_vc_modal buttontext=”JTNDaW1nJTIwY2xhc3MlM0QlMjJhbGlnbnJpZ2h0JTIwc2l6ZS1mdWxsJTIwd3AtaW1hZ2UtMTc4MSUyMiUyMHNyYyUzRCUyMmh0dHBzJTNBJTJGJTJGbWVtcGhpc2NyaW1lLm9yZyUyRndwLWNvbnRlbnQlMkZ1cGxvYWRzJTJGMjAyMSUyRjA1JTJGR3VuX1JlbGF0ZWRfUTFfMjAyMS5qcGclMjIlMjBhbHQlM0QlMjIlMjIlMjB3aWR0aCUzRCUyMjEwMjQlMjIlMjBoZWlnaHQlM0QlMjI2MDAlMjIlMjAlMkYlM0UlMEElMEE=” textcolor=”#333333″ background=”#ffffff”]Gun Related Violent Incidents
 [/cq_vc_modal][/vc_column_inner][vc_column_inner width=”1/3″][vc_column_text]
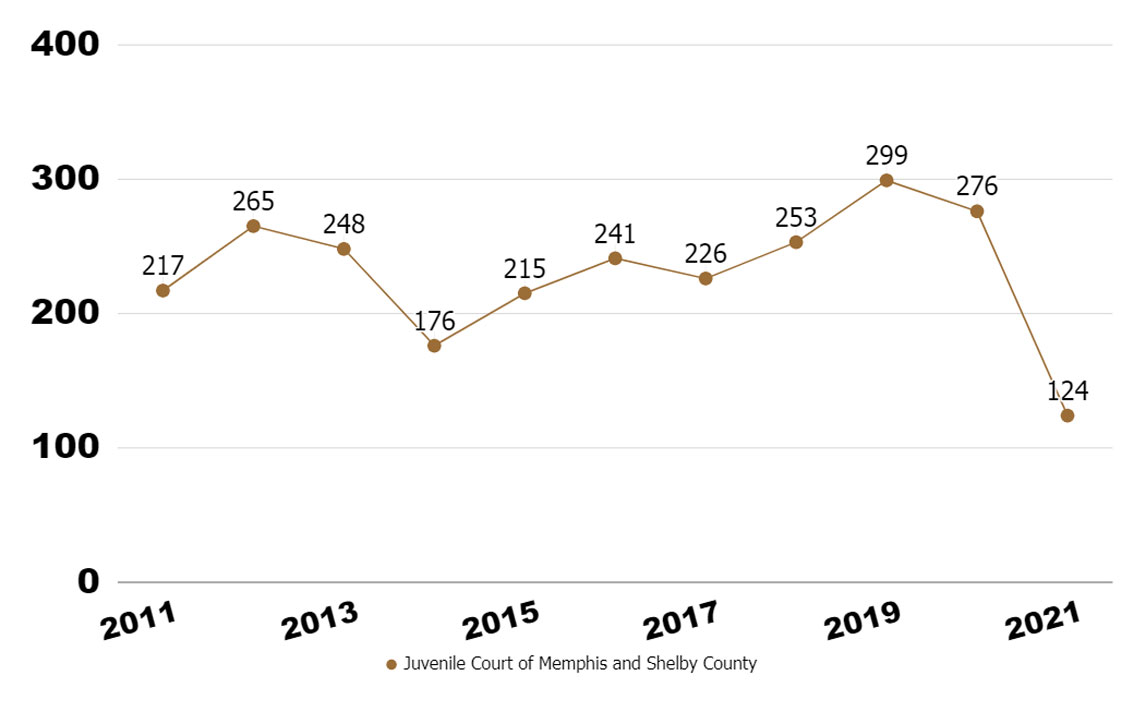
Major Violent Juvenile Charges
[/vc_column_text][cq_vc_modal buttontext=”JTNDaW1nJTIwY2xhc3MlM0QlMjJhbGlnbnJpZ2h0JTIwc2l6ZS1mdWxsJTIwd3AtaW1hZ2UtMTc4MCUyMiUyMHNyYyUzRCUyMmh0dHBzJTNBJTJGJTJGbWVtcGhpc2NyaW1lLm9yZyUyRndwLWNvbnRlbnQlMkZ1cGxvYWRzJTJGMjAyMSUyRjA1JTJGSnV2X1Zpb19RMV8yMDIxLmpwZyUyMiUyMGFsdCUzRCUyMiUyMiUyMHdpZHRoJTNEJTIyMTAyNCUyMiUyMGhlaWdodCUzRCUyMjYwMCUyMiUyMCUyRiUzRQ==” textcolor=”#333333″ background=”#ffffff”]Major Violent Juvenile Charges
 [/cq_vc_modal][/vc_column_inner][vc_column_inner width=”1/3″][vc_column_text]
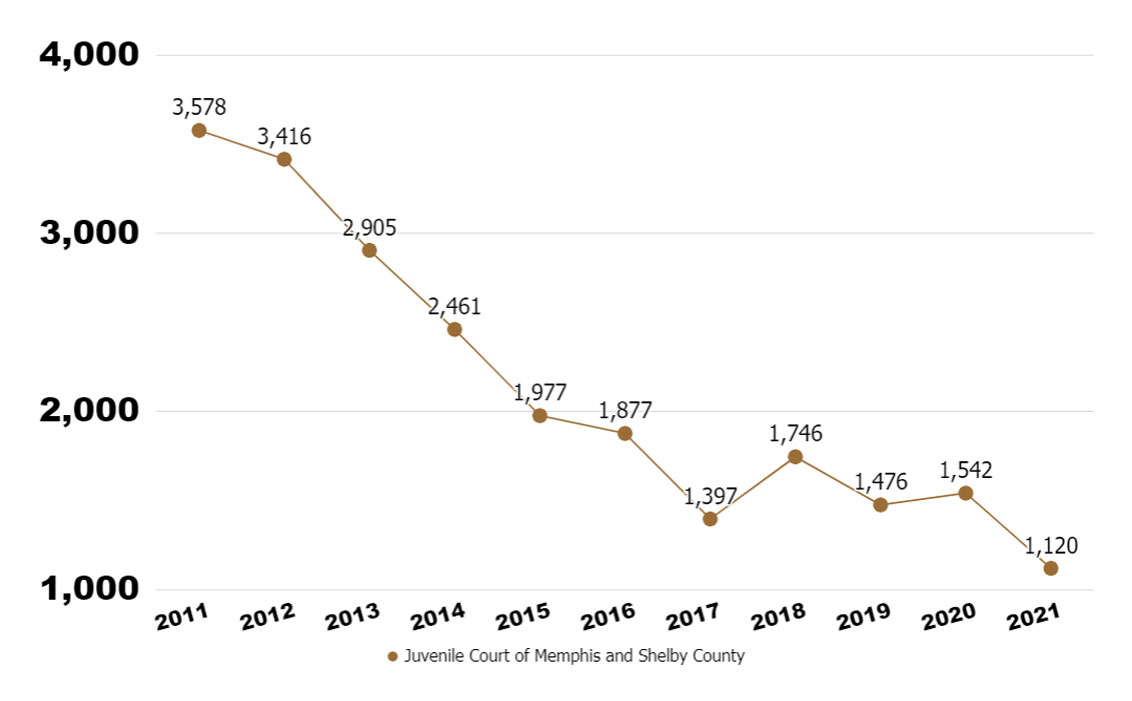
Delinquent Juvenile Charges
[/vc_column_text][cq_vc_modal buttontext=”JTNDaW1nJTIwY2xhc3MlM0QlMjJhbGlnbnJpZ2h0JTIwc2l6ZS1mdWxsJTIwd3AtaW1hZ2UtMTc3OSUyMiUyMHNyYyUzRCUyMmh0dHBzJTNBJTJGJTJGbWVtcGhpc2NyaW1lLm9yZyUyRndwLWNvbnRlbnQlMkZ1cGxvYWRzJTJGMjAyMSUyRjA1JTJGRGVsX0p1dl9RMV8yMDIxLmpwZyUyMiUyMGFsdCUzRCUyMiUyMiUyMHdpZHRoJTNEJTIyMTAyNCUyMiUyMGhlaWdodCUzRCUyMjYwMCUyMiUyMCUyRiUzRQ==” textcolor=”#333333″ background=”#ffffff”]Delinquent Juvenile Charges
 [/cq_vc_modal][/vc_column_inner][/vc_row_inner][vc_row_inner][vc_column_inner width=”1/3″][vc_column_text]
[/vc_column_text][/vc_column_inner][vc_column_inner width=”1/3″][vc_column_text]
[/vc_column_text][/vc_column_inner][vc_column_inner width=”1/3″][vc_column_text]
[/vc_column_text][/vc_column_inner][/vc_row_inner][vc_row_inner][vc_column_inner][vc_empty_space][/vc_column_inner][/vc_row_inner][vc_row_inner][vc_column_inner width=”1/3″][vc_column_text]
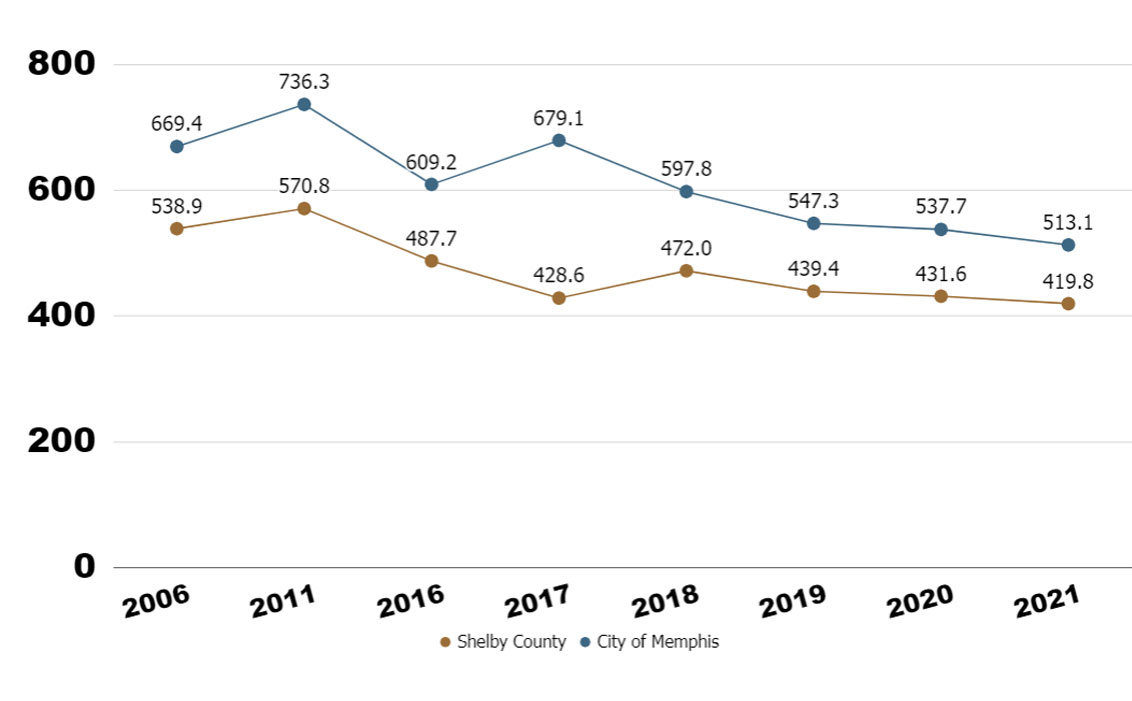
Domestic Violence Incidents
[/vc_column_text][cq_vc_modal buttontext=”JTNDaW1nJTIwY2xhc3MlM0QlMjJhbGlnbnJpZ2h0JTIwc2l6ZS1mdWxsJTIwd3AtaW1hZ2UtMTc4MSUyMiUyMHNyYyUzRCUyMmh0dHBzJTNBJTJGJTJGbWVtcGhpc2NyaW1lLm9yZyUyRndwLWNvbnRlbnQlMkZ1cGxvYWRzJTJGMjAyMSUyRjA1JTJGRG9tZXN0aWNfVmlvX1ExXzIwMjEuanBnJTIyJTIwYWx0JTNEJTIyJTIyJTIwd2lkdGglM0QlMjIxMDI0JTIyJTIwaGVpZ2h0JTNEJTIyNjAwJTIyJTIwJTJGJTNF” textcolor=”#333333″ background=”#ffffff”]Domestic Violence Incidents
(Incidents per 100,000 population)
 [/cq_vc_modal][/vc_column_inner][vc_column_inner width=”1/3″][vc_column_text]
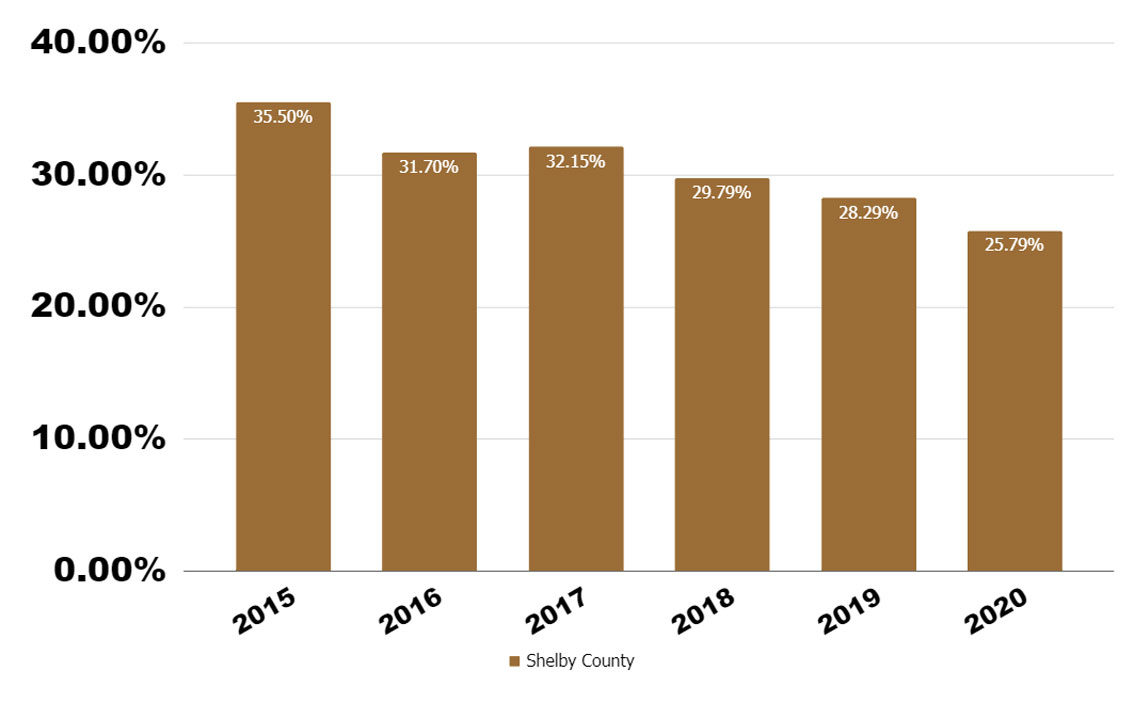
Recidivism Rate
[/vc_column_text][cq_vc_modal buttontext=”JTNDaW1nJTIwY2xhc3MlM0QlMjJhbGlnbnJpZ2h0JTIwc2l6ZS1mdWxsJTIwd3AtaW1hZ2UtMTc4MCUyMiUyMHNyYyUzRCUyMmh0dHBzJTNBJTJGJTJGbWVtcGhpc2NyaW1lLm9yZyUyRndwLWNvbnRlbnQlMkZ1cGxvYWRzJTJGMjAyMSUyRjA1JTJGUmVjaWRpdmlzbV9RMV8yMDIxLmpwZyUyMiUyMGFsdCUzRCUyMiUyMiUyMHdpZHRoJTNEJTIyMTAyNCUyMiUyMGhlaWdodCUzRCUyMjYwMCUyMiUyMCUyRiUzRSUwQSUwQQ==” textcolor=”#333333″ background=”#ffffff”]Recidivism Rate
(Percent)
 [/cq_vc_modal][/vc_column_inner][vc_column_inner width=”1/3″][vc_column_text]
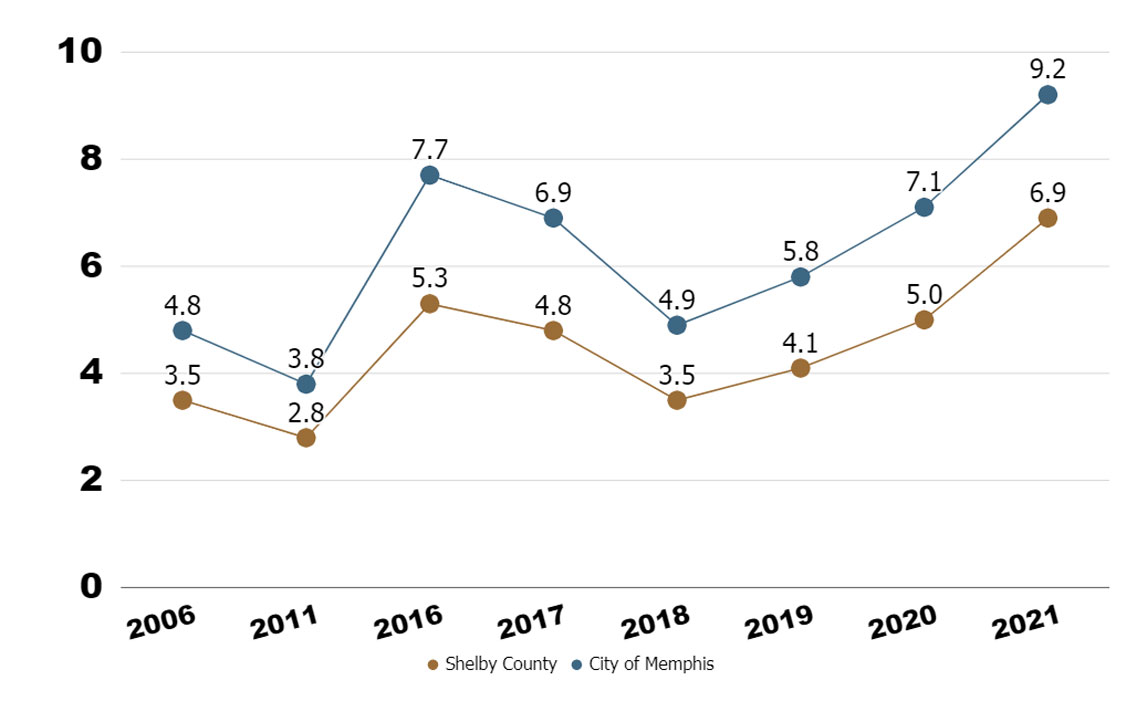
Murders
[/vc_column_text][cq_vc_modal buttontext=”JTNDaW1nJTIwY2xhc3MlM0QlMjJhbGlnbnJpZ2h0JTIwc2l6ZS1mdWxsJTIwd3AtaW1hZ2UtMTc3OSUyMiUyMHNyYyUzRCUyMmh0dHBzJTNBJTJGJTJGbWVtcGhpc2NyaW1lLm9yZyUyRndwLWNvbnRlbnQlMkZ1cGxvYWRzJTJGMjAyMSUyRjA1JTJGTXVyZGVyc19RMV8yMDIxLmpwZyUyMiUyMGFsdCUzRCUyMiUyMiUyMHdpZHRoJTNEJTIyMTAyNCUyMiUyMGhlaWdodCUzRCUyMjYwMCUyMiUyMCUyRiUzRQ==” textcolor=”#333333″ background=”#ffffff”]Murders
(Incidents Per 100,000 population)
 [/cq_vc_modal][/vc_column_inner][/vc_row_inner][vc_row_inner][vc_column_inner width=”1/3″][vc_column_text]
[/vc_column_text][/vc_column_inner][vc_column_inner width=”1/3″][vc_column_text]
[/vc_column_text][/vc_column_inner][vc_column_inner width=”1/3″][vc_column_text]
[/vc_column_text][/vc_column_inner][/vc_row_inner][vc_empty_space height=”60px”][vc_row_inner][vc_column_inner width=”1/3″][vc_column_text]
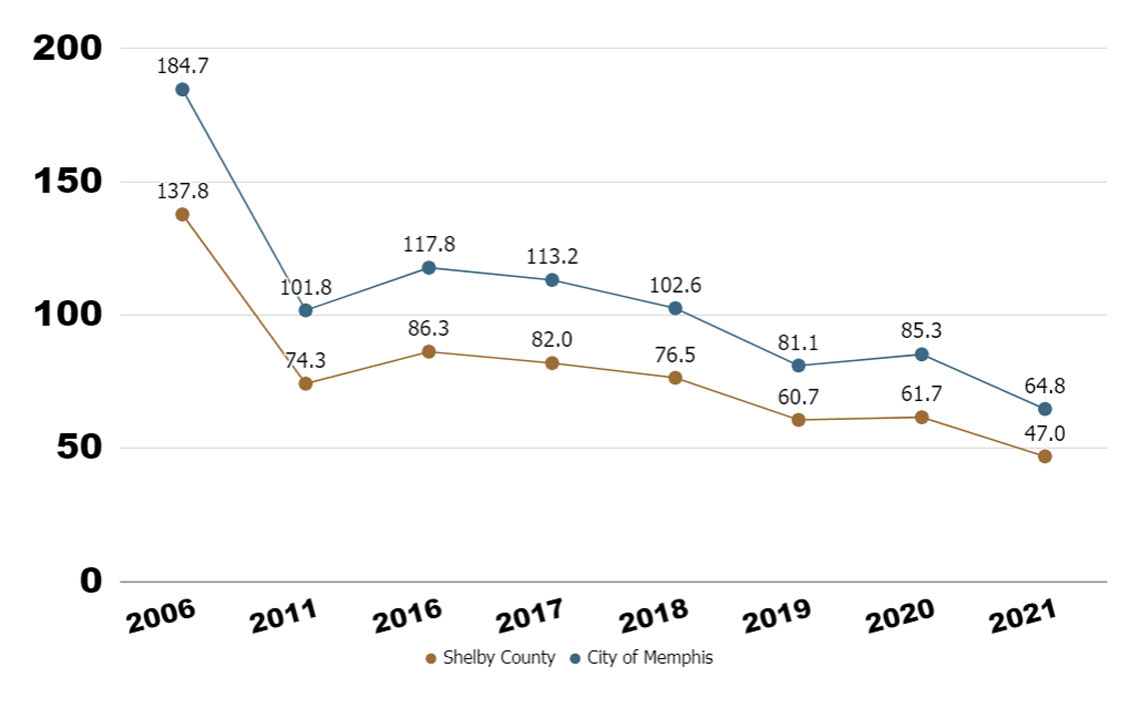
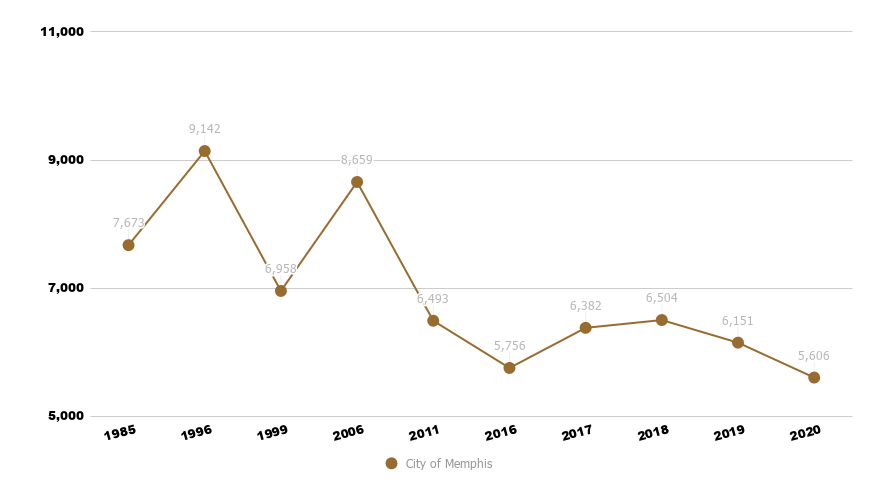
Robberies
[/vc_column_text][cq_vc_modal buttontext=”JTNDaW1nJTIwY2xhc3MlM0QlMjJhbGlnbnJpZ2h0JTIwc2l6ZS1mdWxsJTIwd3AtaW1hZ2UtMTc4MSUyMiUyMHNyYyUzRCUyMmh0dHBzJTNBJTJGJTJGbWVtcGhpc2NyaW1lLm9yZyUyRndwLWNvbnRlbnQlMkZ1cGxvYWRzJTJGMjAyMSUyRjA1JTJGUm9iYmVyaWVzX1ExXzIwMjEuanBnJTIyJTIwYWx0JTNEJTIyJTIyJTIwd2lkdGglM0QlMjIxMDI0JTIyJTIwaGVpZ2h0JTNEJTIyNjAwJTIyJTIwJTJGJTNFJTBB” textcolor=”#333333″ background=”#ffffff”]Reported Robberies
(Incidents per 100,000 population)
 [/cq_vc_modal][/vc_column_inner][vc_column_inner width=”1/3″][vc_column_text]
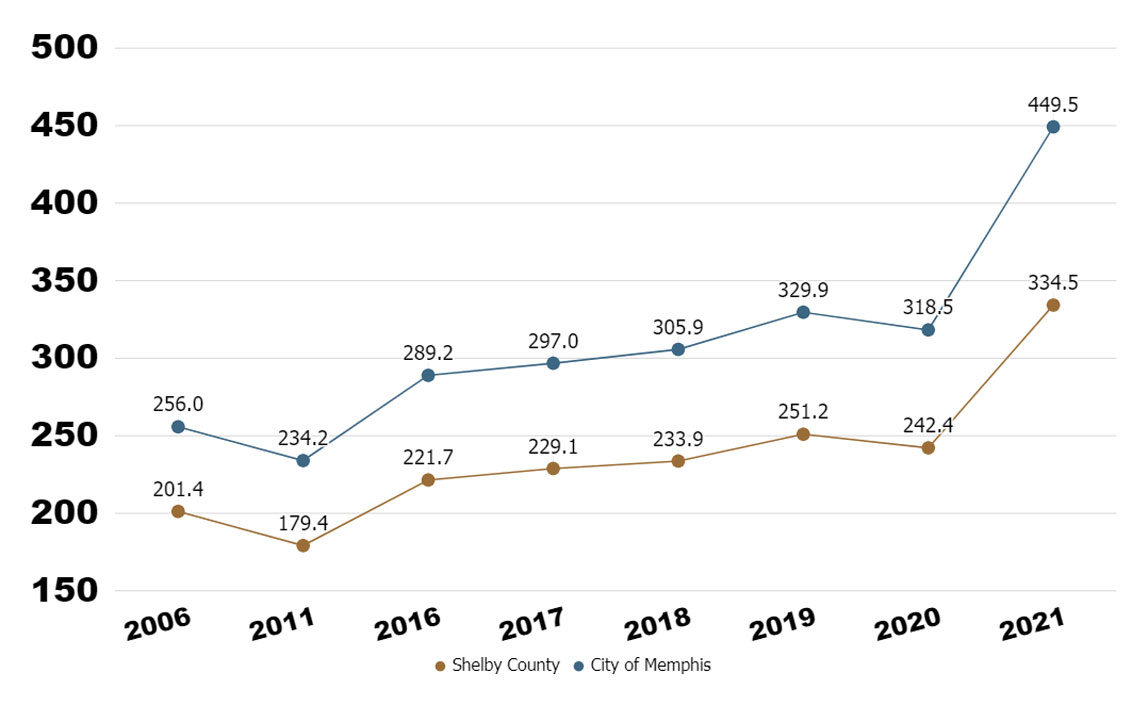
Aggravated Assaults
[/vc_column_text][cq_vc_modal buttontext=”JTNDaW1nJTIwY2xhc3MlM0QlMjJhbGlnbnJpZ2h0JTIwc2l6ZS1mdWxsJTIwd3AtaW1hZ2UtMTc4MSUyMiUyMHNyYyUzRCUyMmh0dHBzJTNBJTJGJTJGbWVtcGhpc2NyaW1lLm9yZyUyRndwLWNvbnRlbnQlMkZ1cGxvYWRzJTJGMjAyMSUyRjA1JTJGQWdnX0Fzc2F1bHRfUTFfMjAyMS5qcGclMjIlMjBhbHQlM0QlMjIlMjIlMjB3aWR0aCUzRCUyMjEwMjQlMjIlMjBoZWlnaHQlM0QlMjI2MDAlMjIlMjAlMkYlM0U=” textcolor=”#333333″ background=”#ffffff”]Aggravated Assults
(Incidents per 100,000 population)
 [/cq_vc_modal][/vc_column_inner][vc_column_inner width=”1/3″][vc_column_text]
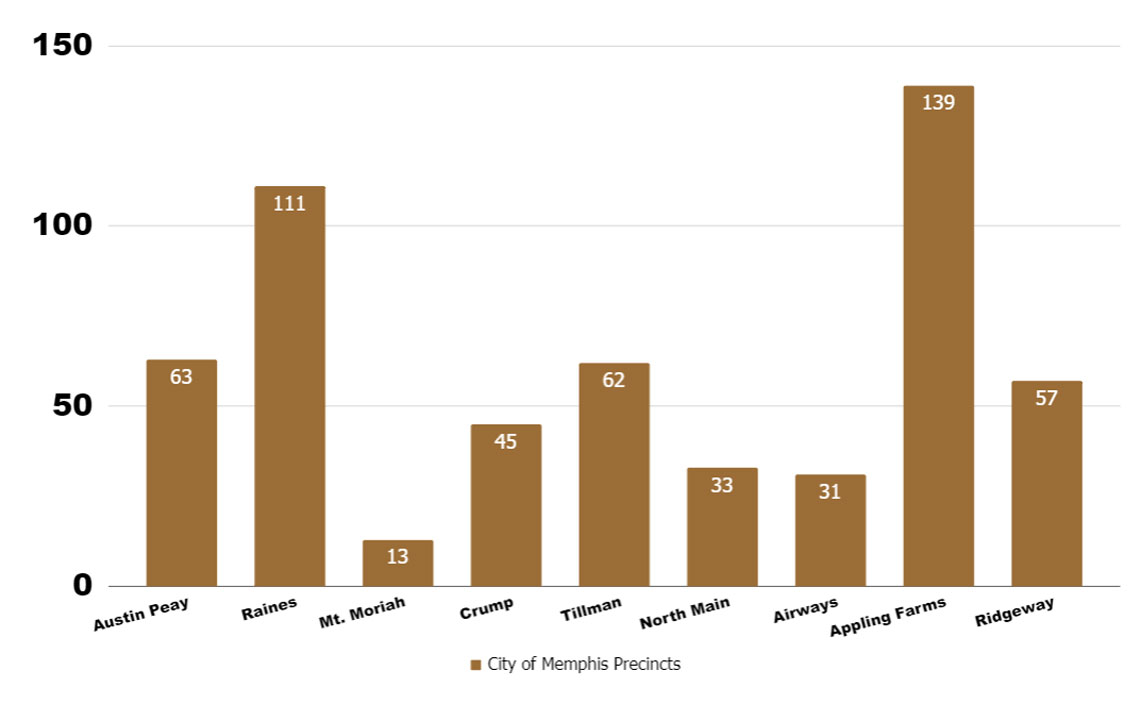
Neighborhood Watch Groups
[/vc_column_text][cq_vc_modal buttontext=”JTNDaW1nJTIwY2xhc3MlM0QlMjJhbGlnbnJpZ2h0JTIwc2l6ZS1mdWxsJTIwd3AtaW1hZ2UtMTc3OSUyMiUyMHNyYyUzRCUyMmh0dHBzJTNBJTJGJTJGbWVtcGhpc2NyaW1lLm9yZyUyRndwLWNvbnRlbnQlMkZ1cGxvYWRzJTJGMjAyMSUyRjA1JTJGTmVpZ2hib3Job29kX1ExXzIwMjEuanBnJTIyJTIwYWx0JTNEJTIyJTIyJTIwd2lkdGglM0QlMjIxMDI0JTIyJTIwaGVpZ2h0JTNEJTIyNjAwJTIyJTIwJTJGJTNF” textcolor=”#333333″ background=”#ffffff”]Neighborhood Watch Groups
(Total Per Precinct)
 [/cq_vc_modal][/vc_column_inner][/vc_row_inner][vc_row_inner][vc_column_inner width=”1/3″][vc_column_text]
[/vc_column_text][/vc_column_inner][vc_column_inner width=”1/3″][vc_column_text]
[/vc_column_text][/vc_column_inner][vc_column_inner width=”1/3″][vc_column_text]
[/vc_column_text][/vc_column_inner][/vc_row_inner][/vc_column][/vc_row][vc_row full_width=”stretch_row” inverse=”” css=”.vc_custom_1598053424104{margin-top: 80px !important;background-color: #ffffff !important;}” el_class=”stats-trends”][vc_column][trx_title type=”3″ style=”underline”]Law Enforcement Staffing[/trx_title][vc_empty_space][vc_row_inner][vc_column_inner width=”1/2″ css=”.vc_custom_1576225093159{padding-right: 20px !important;padding-left: 20px !important;}”][vc_column_text css=”.vc_custom_1580848322771{margin-bottom: 10px !important;padding-bottom: 10px !important;}”]

[/vc_column_text][vc_column_text css=”.vc_custom_1620669143157{border-top-width: 0px !important;padding-top: 10px !important;padding-right: 20px !important;padding-left: 20px !important;border-top-style: solid !important;}”]
March 31, 2021
2,077 Year End 2019
2,020 Year End 2018
1,959 Year End 2017
[/vc_column_text][/vc_column_inner][vc_column_inner width=”1/2″ css=”.vc_custom_1576225128904{padding-right: 20px !important;padding-left: 20px !important;}”][vc_column_text css=”.vc_custom_1580848697310{margin-bottom: 10px !important;padding-bottom: 10px !important;}”]

[/vc_column_text][vc_column_text css=”.vc_custom_1620669199919{border-top-width: 0px !important;border-left-width: 2px !important;padding-top: 10px !important;padding-right: 20px !important;padding-left: 20px !important;}”]
624 Year End 2019
616 Year End 2018
607 Year End 2017
March 31, 2021
[/vc_column_text][/vc_column_inner][/vc_row_inner][vc_separator][/vc_column][/vc_row][vc_row full_width=”stretch_row” inverse=”” css=”.vc_custom_1576876116246{margin-top: 80px !important;background-color: #f5f6f7 !important;}” el_class=”stats-trends”][vc_column][vc_empty_space height=”60px”][trx_title type=”3″ style=”underline”]Safe Community Plan Objective Outcome Indicators[/trx_title][vc_empty_space][vc_row_inner][vc_column_inner width=”1/2″ css=”.vc_custom_1576225093159{padding-right: 20px !important;padding-left: 20px !important;}”][vc_column_text css=”.vc_custom_1580849767683{border-top-width: 0px !important;padding-top: 10px !important;padding-right: 20px !important;padding-left: 20px !important;border-top-style: solid !important;}”]
How Our Objectives Map To Our Outcomes
- Goal A: Strengthen community engagement in crime prevention efforts.
- Goal B: Strengthen law enforcement’s ability to reduce violent street crime.
- Goal C: Strengthen intervention programs for ex-offenders.
- Goal D: Enhance domestic violence prevention and intervention efforts.
- Goal E: Enhance interventions for youth committing delinquent acts.
[/vc_column_text][vc_empty_space][vc_btn title=”Get The Latest Objective Outcomes” style=”custom” custom_background=”#a06a22″ custom_text=”#ffffff” link=”url:https%3A%2F%2Fmemphiscrime.org%2Fwp-content%2Fuploads%2F2021%2F05%2FOBJECTIVE-OUTCOME-INDICATORS-1st-QTR-2021.pdf|target:_blank”][/vc_column_inner][vc_column_inner width=”1/2″ css=”.vc_custom_1576225128904{padding-right: 20px !important;padding-left: 20px !important;}”][vc_single_image image=”2581″ img_size=”full” alignment=”center” onclick=”custom_link” img_link_target=”_blank” link=”https://memphiscrime.org/wp-content/uploads/2021/05/OBJECTIVE-OUTCOME-INDICATORS-1st-QTR-2021.pdf”][/vc_column_inner][/vc_row_inner][/vc_column][/vc_row][vc_row][vc_column][vc_row_inner][vc_column_inner][vc_empty_space height=”50px”][/vc_column_inner][/vc_row_inner][trx_title type=”3″ style=”underline” color=”#a06921″]Recent Media Releases[/trx_title][vc_empty_space][vc_row_inner][vc_column_inner width=”1/4″][vc_icon icon_fontawesome=”fa fa-file-text-o” color=”custom” size=”lg” align=”center” custom_color=”#4a7289″ link=”url:https%3A%2F%2Fmemphiscrime.org%2Fwp-content%2Fuploads%2F2020%2F11%2FMEDIA-OCTOBER-3rd-QTR-JAN-SEP-2020-Media-Release-Crime-Stats.pdf||target:%20_blank|” css=”.vc_custom_1578806240798{margin-bottom: 0px !important;}”][vc_separator el_width=”80″ css=”.vc_custom_1578806212712{margin-bottom: 10px !important;}”][vc_column_text]
October 2020 3rd Quarter Media Release Crime Stats
[/vc_column_text][/vc_column_inner][vc_column_inner width=”1/4″][vc_icon icon_fontawesome=”fa fa-file-text-o” color=”custom” size=”lg” align=”center” custom_color=”#4a7289″ link=”url:https%3A%2F%2Fmemphiscrime.org%2Fwp-content%2Fuploads%2F2020%2F08%2FMEDIA-JUNE-2nd-QTR-JAN-JUN-2020-Media-Release-Crime-Stats.pdf||target:%20_blank|” css=”.vc_custom_1597241017851{margin-bottom: 0px !important;}”][vc_separator el_width=”80″ css=”.vc_custom_1578806208595{margin-bottom: 10px !important;}”][vc_column_text]
June 2020 2nd Quarter Media Release Crime Stats
[/vc_column_text][/vc_column_inner][vc_column_inner width=”1/4″][vc_icon icon_fontawesome=”fa fa-file-text-o” color=”custom” size=”lg” align=”center” custom_color=”#4a7289″ link=”url:https%3A%2F%2Fmemphiscrime.org%2Fwp-content%2Fuploads%2F2020%2F04%2F1st_QTR_2020_-Media_Release_Crime_Stats.pdf||target:%20_blank|” css=”.vc_custom_1597241161843{margin-bottom: 0px !important;}”][vc_separator el_width=”80″ css=”.vc_custom_1578806201102{margin-bottom: 10px !important;}”][vc_column_text]
March 2020 1st Quarter Media Release Crime Stats
[/vc_column_text][/vc_column_inner][vc_column_inner width=”1/4″][vc_icon icon_fontawesome=”fa fa-file-text-o” color=”custom” size=”lg” align=”center” custom_color=”#4a7289″ link=”url:https%3A%2F%2Fmemphiscrime.org%2Fwp-content%2Fuploads%2F2020%2F01%2FDECEMBER-2019-4th-QTR-SEP-DEC-2019-Media-Release-Crime-Stats.pdf||target:%20_blank|” css=”.vc_custom_1579675164529{margin-bottom: 0px !important;}”][vc_separator el_width=”80″ css=”.vc_custom_1578806137673{margin-bottom: 10px !important;}”][vc_column_text]
December 2019 4th Quarter Media Release Crime Stats
[/vc_column_text][/vc_column_inner][/vc_row_inner][/vc_column][/vc_row][vc_row full_width=”stretch_row” inverse=”” css=”.vc_custom_1598052830533{margin-top: 80px !important;background-color: #f5f6f7 !important;}” el_class=”stats-trends”][vc_column][vc_empty_space height=”60px”][trx_title type=”3″ style=”underline”]Long-Term Annual Crime Trends[/trx_title][vc_empty_space][vc_row_inner css=”.vc_custom_1576879160653{border-left-width: 15px !important;border-left-color: #000000 !important;border-radius: 3px !important;}”][vc_column_inner width=”1/2″ css=”.vc_custom_1578809622465{margin-right: 20px !important;margin-left: 10px !important;padding-top: 20px !important;padding-right: 20px !important;padding-bottom: 20px !important;padding-left: 20px !important;background-color: #f5f6f7 !important;}”][vc_column_text css=”.vc_custom_1598030582852{margin-right: 20px !important;}”]
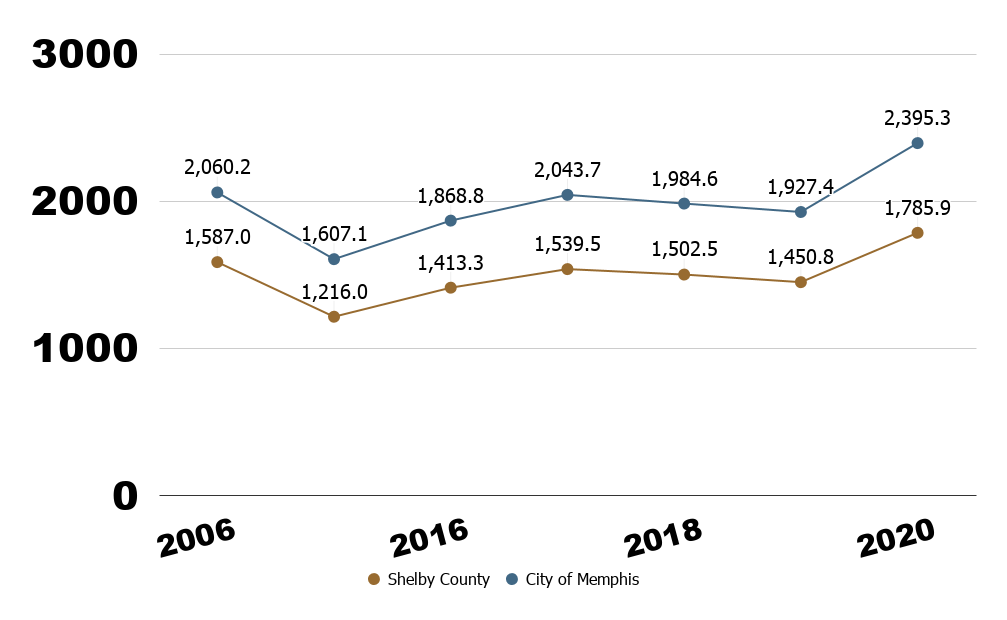
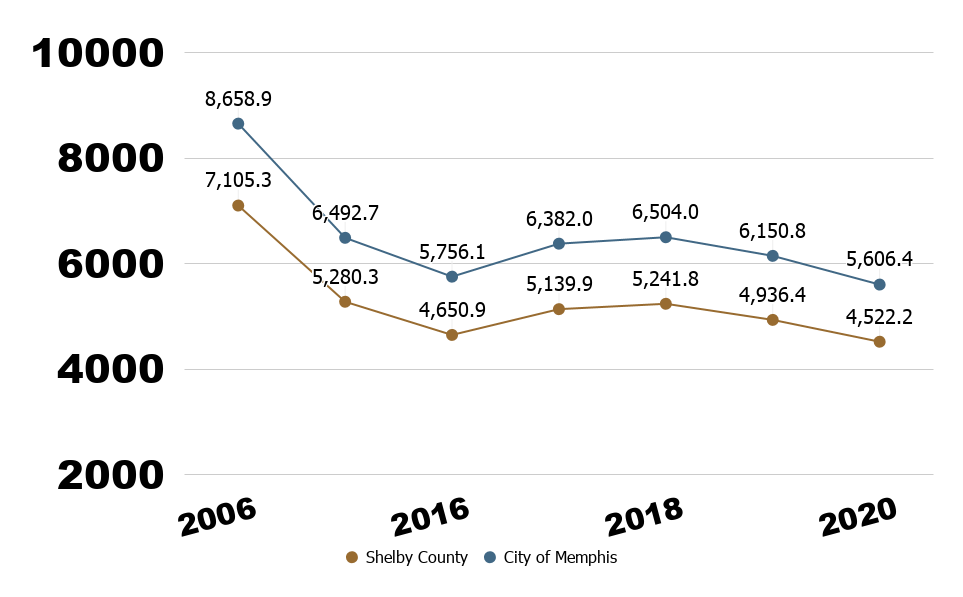
Major Violent Crime Long Term Trend in City of Memphis
[/vc_column_text][cq_vc_modal buttontext=”JTNDaW1nJTIwY2xhc3MlM0QlMjJhbGlnbnJpZ2h0JTIwc2l6ZS1mdWxsJTIwd3AtaW1hZ2UtMTU4OCUyMiUyMHNyYyUzRCUyMiUyRndwLWNvbnRlbnQlMkZ1cGxvYWRzJTJGMjAyMSUyRjAzJTJGTWFqb3JWaW9sZW50TG9uZ1Rlcm1DcmltZS5wbmclMjIlMjBhbHQlM0QlMjIlMjIlMjB3aWR0aCUzRCUyMjEwMDAlMjIlMjBoZWlnaHQlM0QlMjI2MDAlMjIlMjAlMkYlM0UlMEElMEElMEE=” textcolor=”#333333″ background=”#ffffff”]Major Violent Crime Long Term Trend in City of Memphis
(Incidents per 100,000 population)
[/cq_vc_modal][/vc_column_inner][vc_column_inner width=”1/2″ css=”.vc_custom_1579065702230{padding-top: 20px !important;padding-right: 20px !important;padding-bottom: 20px !important;padding-left: 20px !important;}”][vc_column_text css=”.vc_custom_1598030591675{margin-right: 20px !important;}”]
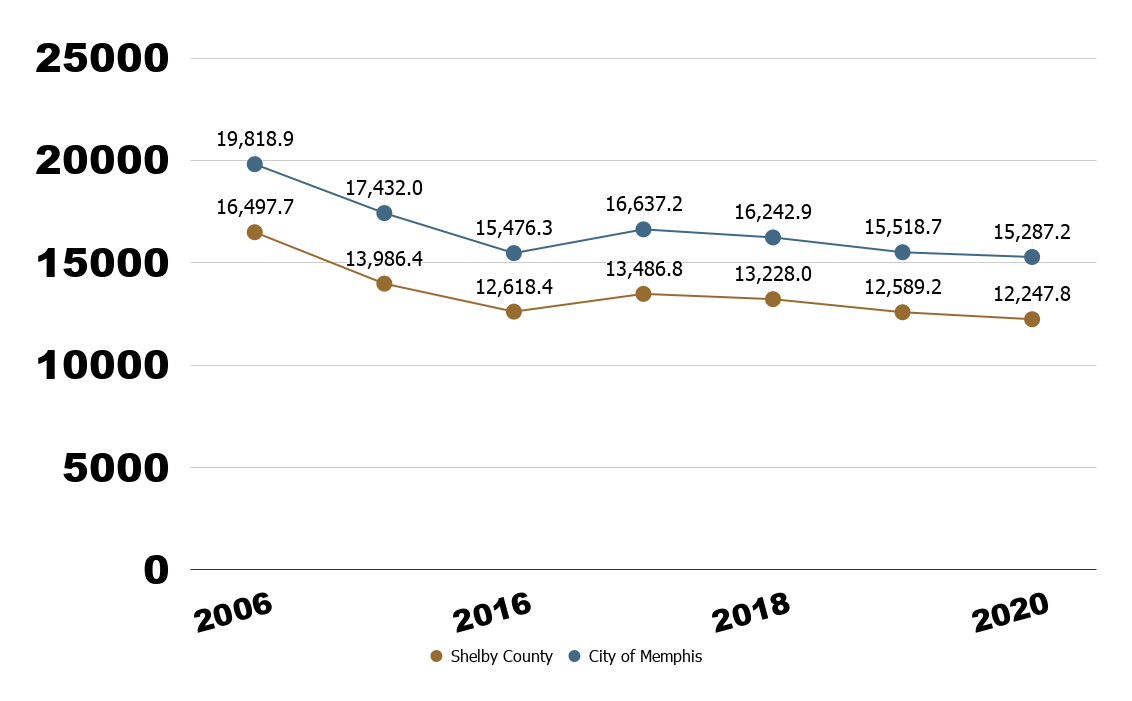
Major Property Crime Long Term Trend in City of Memphis
[/vc_column_text][cq_vc_modal buttontext=”JTNDaW1nJTIwY2xhc3MlM0QlMjJhbGlnbnJpZ2h0JTIwc2l6ZS1mdWxsJTIwd3AtaW1hZ2UtMTU4OCUyMiUyMHNyYyUzRCUyMmh0dHBzJTNBJTJGJTJGbWVtcGhpc2NyaW1lLm9yZyUyRndwLWNvbnRlbnQlMkZ1cGxvYWRzJTJGMjAyMSUyRjAzJTJGTWFqb3JQcm9wZXJ0eUxvbmdUZXJtQ3JpbWUyLnBuZyUyMiUyMGFsdCUzRCUyMiUyMiUyMHdpZHRoJTNEJTIyMTAwMCUyMiUyMGhlaWdodCUzRCUyMjYwMCUyMiUyMCUyRiUzRQ==” textcolor=”#333333″ background=”#ffffff”]Major Property Crime Long Term Trend in City of Memphis
(Incidents per 100,000 population)
 [/cq_vc_modal][/vc_column_inner][/vc_row_inner][vc_empty_space][/vc_column][/vc_row][vc_row][vc_column][vc_empty_space height=”40″][trx_title type=”3″ style=”underline” color=”#a06921″]YEAR END CRIME STATS 2006-2020[/trx_title][vc_empty_space height=”32″][vc_row_inner][vc_column_inner width=”1/3″][vc_column_text]
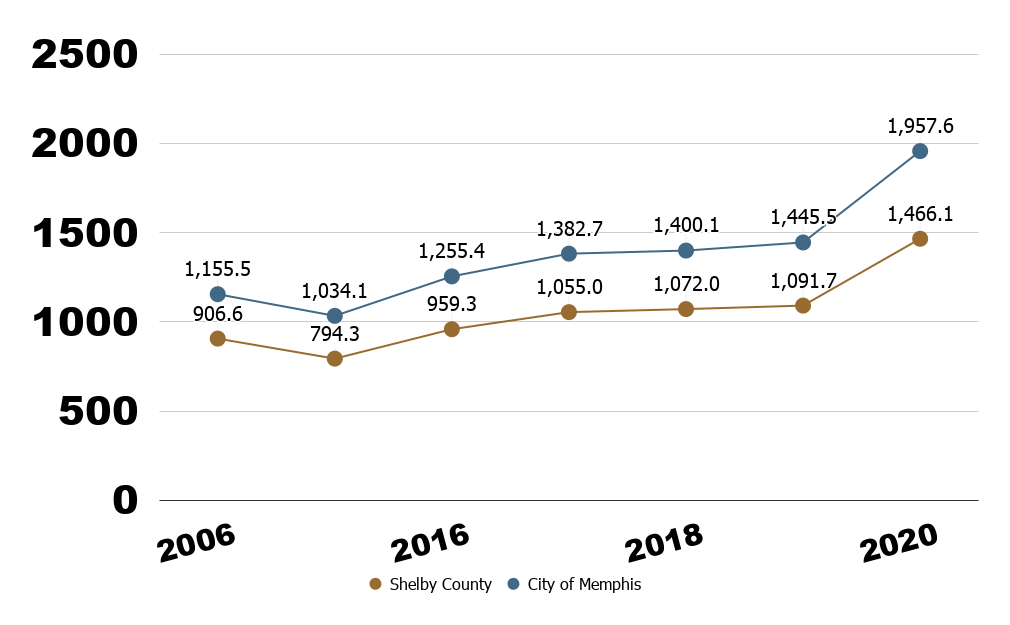
Overall Crime
[/vc_column_text][cq_vc_modal buttontext=”JTNDaW1nJTIwY2xhc3MlM0QlMjJhbGlnbnJpZ2h0JTIwc2l6ZS1mdWxsJTIwd3AtaW1hZ2UtMTc4MSUyMiUyMHNyYyUzRCUyMmh0dHBzJTNBJTJGJTJGbWVtcGhpc2NyaW1lLm9yZyUyRndwLWNvbnRlbnQlMkZ1cGxvYWRzJTJGMjAyMSUyRjAzJTJGT3ZlcmFsbENyaW1lLnBuZyUyMiUyMGFsdCUzRCUyMiUyMiUyMHdpZHRoJTNEJTIyMTAyNCUyMiUyMGhlaWdodCUzRCUyMjYwMCUyMiUyMCUyRiUzRQ==” textcolor=”#333333″ background=”#ffffff”]Overall Crime
(Incidents per 100,000 population)
 [/cq_vc_modal][/vc_column_inner][vc_column_inner width=”1/3″][vc_column_text]
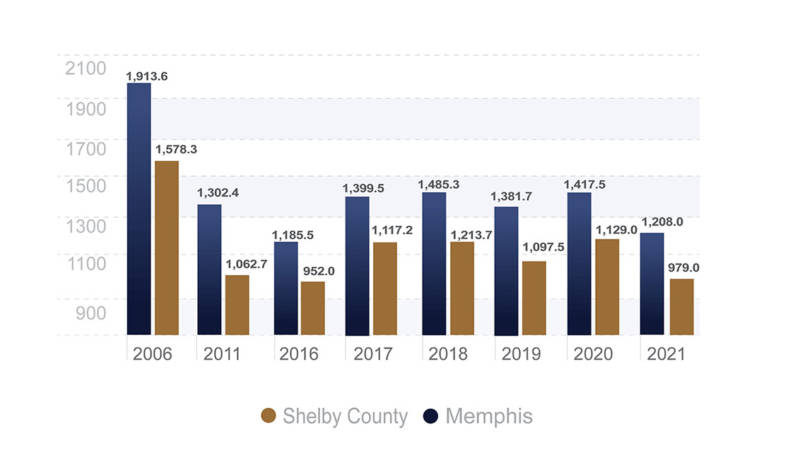
Major Violent Crime
[/vc_column_text][cq_vc_modal buttontext=”JTNDaW1nJTIwY2xhc3MlM0QlMjJhbGlnbnJpZ2h0JTIwc2l6ZS1mdWxsJTIwd3AtaW1hZ2UtMTc4MCUyMiUyMHNyYyUzRCUyMmh0dHBzJTNBJTJGJTJGbWVtcGhpc2NyaW1lLm9yZyUyRndwLWNvbnRlbnQlMkZ1cGxvYWRzJTJGMjAyMSUyRjAzJTJGTWFqb3JWaW9sZW50Q3JpbWUucG5nJTIyJTIwYWx0JTNEJTIyJTIyJTIwd2lkdGglM0QlMjIxMDI0JTIyJTIwaGVpZ2h0JTNEJTIyNjAwJTIyJTIwJTJGJTNFJTBBJTBB” textcolor=”#333333″ background=”#ffffff”]Major Violent Crime
(Incidents per 100,000 population)
 [/cq_vc_modal][/vc_column_inner][vc_column_inner width=”1/3″][vc_column_text]
Major Property Crime
[/vc_column_text][cq_vc_modal buttontext=”JTNDaW1nJTIwY2xhc3MlM0QlMjJhbGlnbnJpZ2h0JTIwc2l6ZS1mdWxsJTIwd3AtaW1hZ2UtMTc3OSUyMiUyMHNyYyUzRCUyMmh0dHBzJTNBJTJGJTJGbWVtcGhpc2NyaW1lLm9yZyUyRndwLWNvbnRlbnQlMkZ1cGxvYWRzJTJGMjAyMSUyRjAzJTJGTWFqb3JQcm9wQ3JpbWUucG5nJTIyJTIwYWx0JTNEJTIyJTIyJTIwd2lkdGglM0QlMjIxMDI0JTIyJTIwaGVpZ2h0JTNEJTIyNjAwJTIyJTIwJTJGJTNF” textcolor=”#333333″ background=”#ffffff”]Major Property Crime
(Incidents per 100,000 population)
 [/cq_vc_modal][/vc_column_inner][/vc_row_inner][/vc_column][/vc_row][vc_row inverse=”” el_class=”stats-trends” css=”.vc_custom_1576878966303{border-radius: 2px !important;}”][vc_column width=”1/3″ css=”.vc_custom_1576878906461{border-right-width: 0px !important;}”][vc_column_text]
[/vc_column_text][/vc_column][vc_column width=”1/3″ css=”.vc_custom_1576879058114{padding-top: 30px !important;}”][vc_column_text]
[/vc_column_text][/vc_column][vc_column width=”1/3″ css=”.vc_custom_1576879127043{padding-top: 30px !important;}”][vc_column_text]
[/vc_column_text][/vc_column][/vc_row][vc_row][vc_column][vc_empty_space height=”60px”][vc_row_inner][vc_column_inner width=”1/3″][vc_column_text]
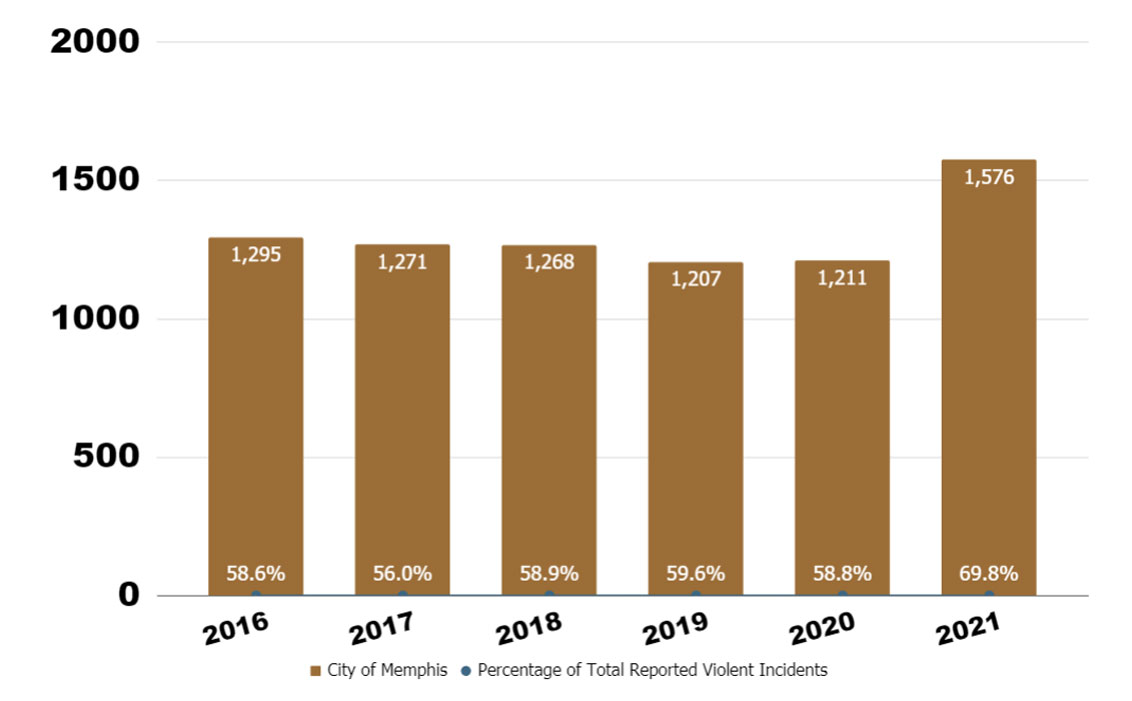
Gun Related Violent Incidents
[/vc_column_text][cq_vc_modal buttontext=”JTNDaW1nJTIwY2xhc3MlM0QlMjJhbGlnbnJpZ2h0JTIwc2l6ZS1mdWxsJTIwd3AtaW1hZ2UtMTc4MSUyMiUyMHNyYyUzRCUyMmh0dHBzJTNBJTJGJTJGbWVtcGhpc2NyaW1lLm9yZyUyRndwLWNvbnRlbnQlMkZ1cGxvYWRzJTJGMjAyMSUyRjAzJTJGR3VuUmVsYXRlZC5wbmclMjIlMjBhbHQlM0QlMjIlMjIlMjB3aWR0aCUzRCUyMjEwMjQlMjIlMjBoZWlnaHQlM0QlMjI2MDAlMjIlMjAlMkYlM0UlMEElMEE=” textcolor=”#333333″ background=”#ffffff”]Gun Related Violent Incidents
 [/cq_vc_modal][/vc_column_inner][vc_column_inner width=”1/3″][vc_column_text]
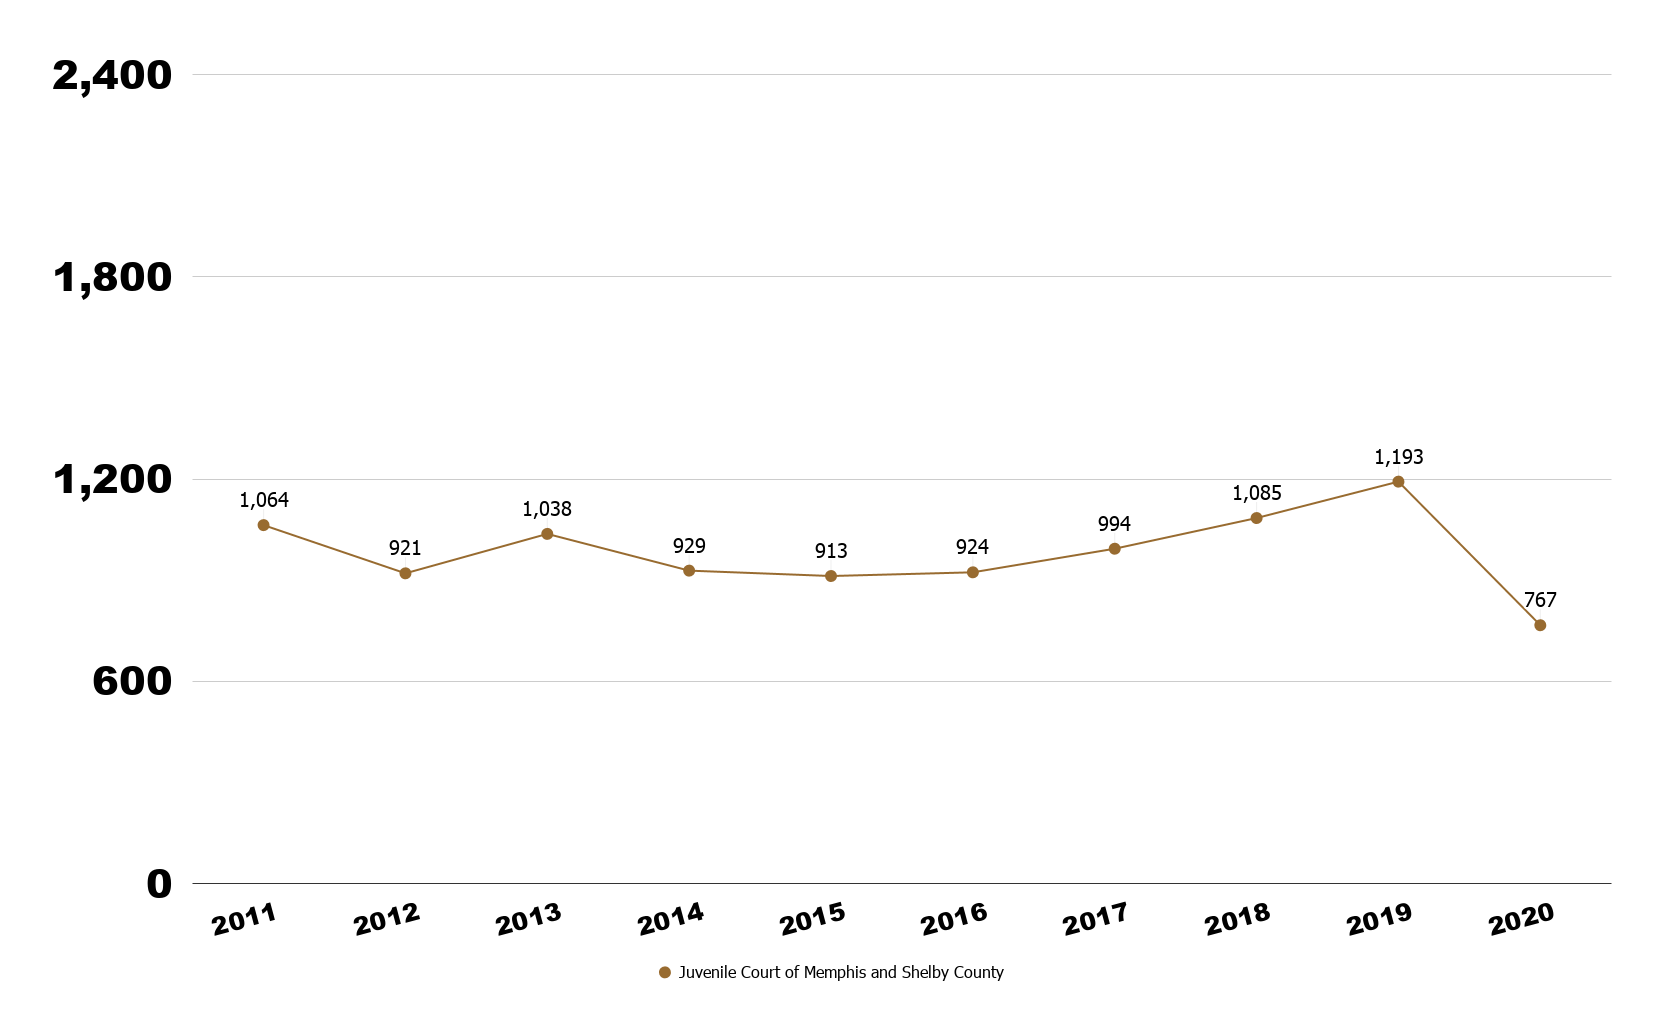
Major Violent Juvenile Charges
[/vc_column_text][cq_vc_modal buttontext=”JTNDaW1nJTIwY2xhc3MlM0QlMjJhbGlnbnJpZ2h0JTIwc2l6ZS1mdWxsJTIwd3AtaW1hZ2UtMTc4MCUyMiUyMHNyYyUzRCUyMmh0dHBzJTNBJTJGJTJGbWVtcGhpc2NyaW1lLm9yZyUyRndwLWNvbnRlbnQlMkZ1cGxvYWRzJTJGMjAyMSUyRjAzJTJGTWFqb3JKdXZpTG9uZ1Rlcm1DcmltZTIucG5nJTIyJTIwYWx0JTNEJTIyJTIyJTIwd2lkdGglM0QlMjIxMDI0JTIyJTIwaGVpZ2h0JTNEJTIyNjAwJTIyJTIwJTJGJTNF” textcolor=”#333333″ background=”#ffffff”]Major Violent Juvenile Charges
 [/cq_vc_modal][/vc_column_inner][vc_column_inner width=”1/3″][vc_column_text]
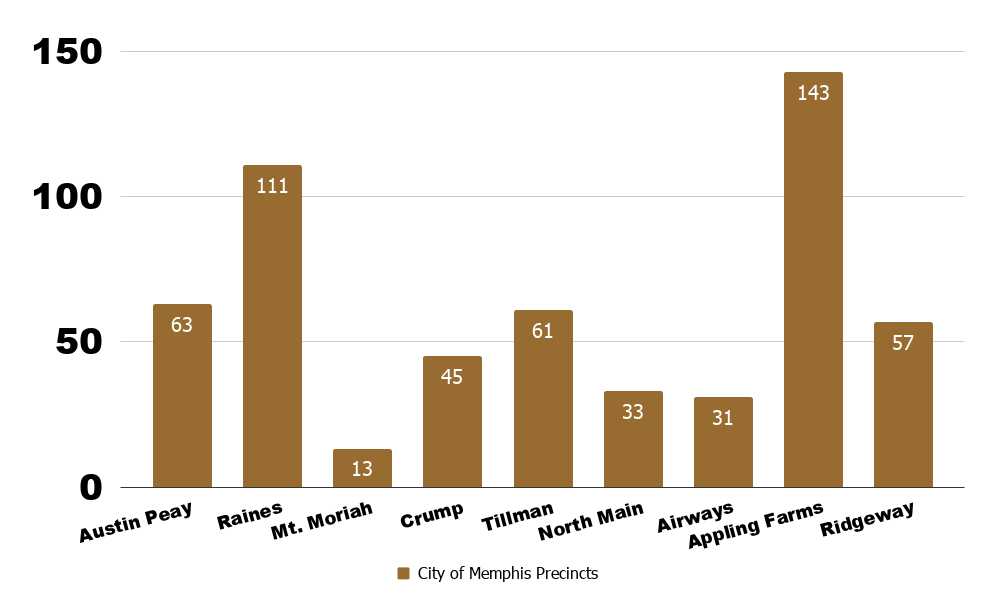
Neighborhood Watch Groups
[/vc_column_text][cq_vc_modal buttontext=”JTNDaW1nJTIwY2xhc3MlM0QlMjJhbGlnbnJpZ2h0JTIwc2l6ZS1mdWxsJTIwd3AtaW1hZ2UtMTc3OSUyMiUyMHNyYyUzRCUyMmh0dHBzJTNBJTJGJTJGbWVtcGhpc2NyaW1lLm9yZyUyRndwLWNvbnRlbnQlMkZ1cGxvYWRzJTJGMjAyMSUyRjAzJTJGTmVpZ2hib3Job29kV2F0Y2gucG5nJTIyJTIwYWx0JTNEJTIyJTIyJTIwd2lkdGglM0QlMjIxMDI0JTIyJTIwaGVpZ2h0JTNEJTIyNjAwJTIyJTIwJTJGJTNF” textcolor=”#333333″ background=”#ffffff”]Neighborhood Watch Groups
(Total Per Precinct)
 [/cq_vc_modal][/vc_column_inner][/vc_row_inner][vc_row_inner][vc_column_inner width=”1/3″][vc_column_text]
[/vc_column_text][/vc_column_inner][vc_column_inner width=”1/3″][vc_column_text]
[/vc_column_text][/vc_column_inner][vc_column_inner width=”1/3″][vc_column_text]
[/vc_column_text][/vc_column_inner][vc_column_inner][vc_empty_space height=”60px”][/vc_column_inner][/vc_row_inner][vc_row_inner][vc_column_inner width=”1/3″][vc_column_text]
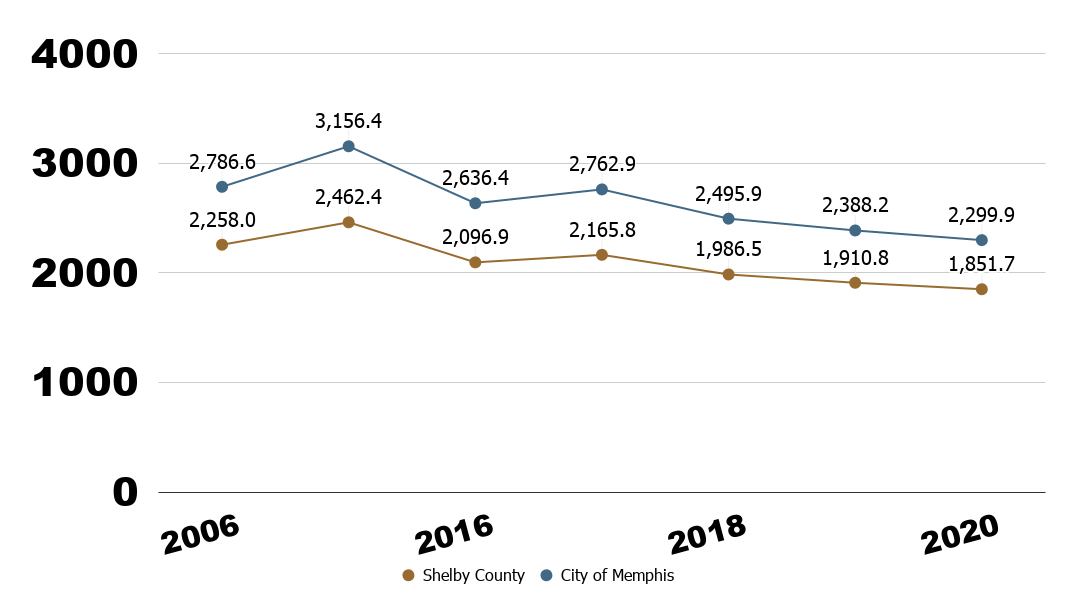
Domestic Violence Incidents
[/vc_column_text][cq_vc_modal buttontext=”JTNDaW1nJTIwY2xhc3MlM0QlMjJhbGlnbnJpZ2h0JTIwc2l6ZS1mdWxsJTIwd3AtaW1hZ2UtMTc4MSUyMiUyMHNyYyUzRCUyMmh0dHBzJTNBJTJGJTJGbWVtcGhpc2NyaW1lLm9yZyUyRndwLWNvbnRlbnQlMkZ1cGxvYWRzJTJGMjAyMSUyRjAzJTJGRG9tZXN0aWNWaW9sZW5jZS5wbmclMjIlMjBhbHQlM0QlMjIlMjIlMjB3aWR0aCUzRCUyMjEwMjQlMjIlMjBoZWlnaHQlM0QlMjI2MDAlMjIlMjAlMkYlM0U=” textcolor=”#333333″ background=”#ffffff”]Domestic Violence Incidents
(Incidents per 100,000 population)
 [/cq_vc_modal][/vc_column_inner][vc_column_inner width=”1/3″][vc_column_text]
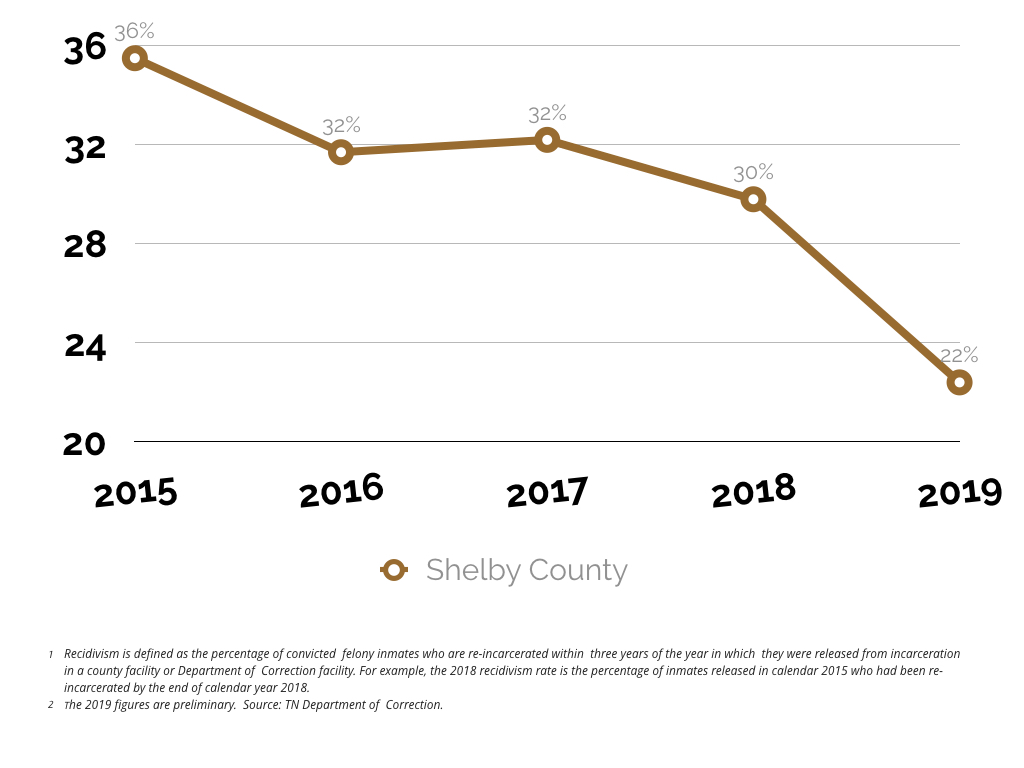
Recidivism Rate
[/vc_column_text][cq_vc_modal buttontext=”JTNDaW1nJTIwY2xhc3MlM0QlMjJhbGlnbnJpZ2h0JTIwc2l6ZS1mdWxsJTIwd3AtaW1hZ2UtMTc4MCUyMiUyMHNyYyUzRCUyMiUyRndwLWNvbnRlbnQlMkZ1cGxvYWRzJTJGMjAyMCUyRjAxJTJGcmVjaWRpdmlzbS1yYXRlLWNyaW1lLWNvbW1pc3Npb24tZ3JhcGhzLTIwMjAwMTIyLnBuZyUyMiUyMGFsdCUzRCUyMiUyMiUyMHdpZHRoJTNEJTIyMTAyNCUyMiUyMGhlaWdodCUzRCUyMjYwMCUyMiUyMCUyRiUzRSUwQSUwQQ==” textcolor=”#333333″ background=”#ffffff”]Recidivism Rate
(Percent)
 [/cq_vc_modal][/vc_column_inner][vc_column_inner width=”1/3″][vc_column_text]
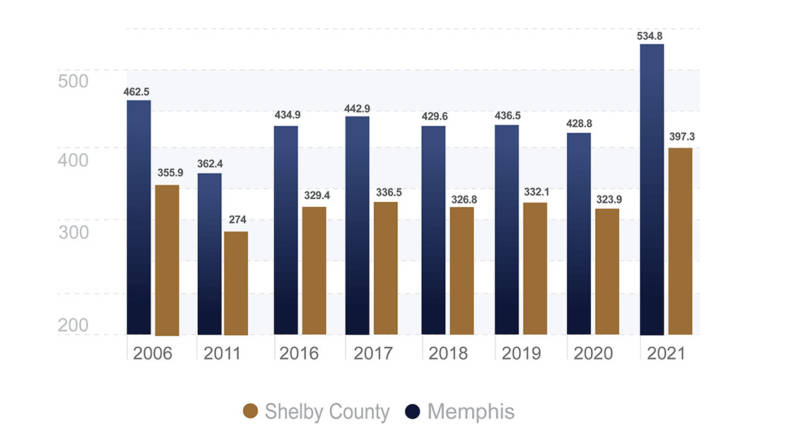
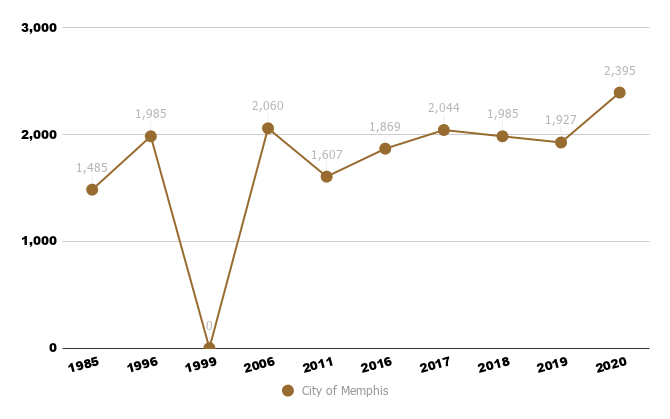
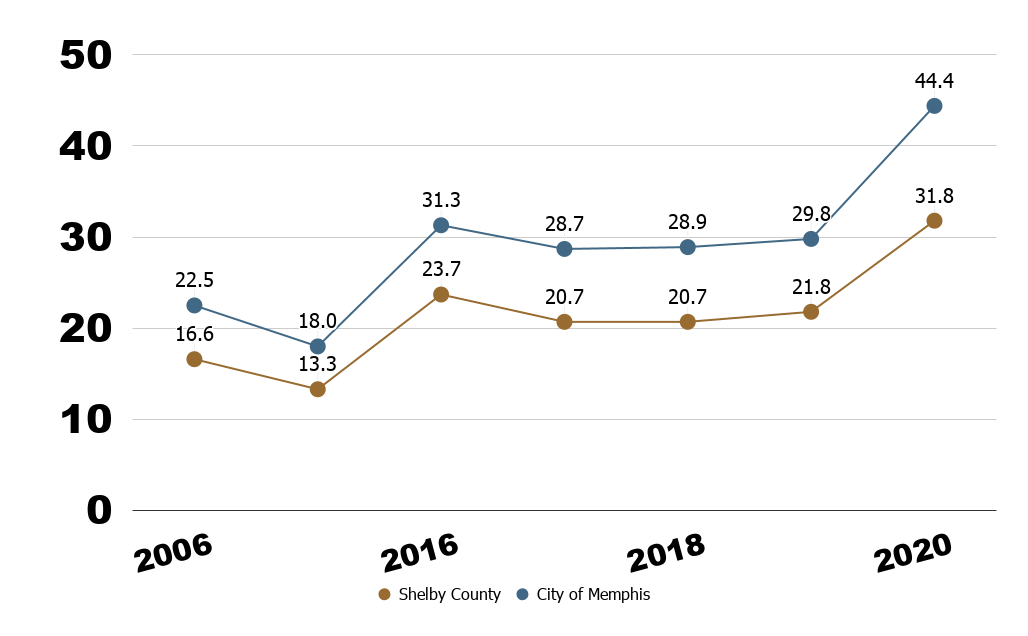
Murders
[/vc_column_text][cq_vc_modal buttontext=”JTNDaW1nJTIwY2xhc3MlM0QlMjJhbGlnbnJpZ2h0JTIwc2l6ZS1mdWxsJTIwd3AtaW1hZ2UtMTc3OSUyMiUyMHNyYyUzRCUyMmh0dHBzJTNBJTJGJTJGbWVtcGhpc2NyaW1lLm9yZyUyRndwLWNvbnRlbnQlMkZ1cGxvYWRzJTJGMjAyMSUyRjAzJTJGTXVyZGVycy5wbmclMjIlMjBhbHQlM0QlMjIlMjIlMjB3aWR0aCUzRCUyMjEwMjQlMjIlMjBoZWlnaHQlM0QlMjI2MDAlMjIlMjAlMkYlM0U=” textcolor=”#333333″ background=”#ffffff”]Murders
(Incidents Per 100,000 population)
 [/cq_vc_modal][/vc_column_inner][/vc_row_inner][/vc_column][/vc_row][vc_row inverse=”” el_class=”stats-trends” css=”.vc_custom_1576878966303{border-radius: 2px !important;}”][vc_column width=”1/3″ css=”.vc_custom_1576878906461{border-right-width: 0px !important;}”][vc_column_text]
[/vc_column_text][/vc_column][vc_column width=”1/3″ css=”.vc_custom_1576879058114{padding-top: 30px !important;}”][vc_column_text]
[/vc_column_text][/vc_column][vc_column width=”1/3″ css=”.vc_custom_1576879127043{padding-top: 30px !important;}”][vc_column_text]
[/vc_column_text][/vc_column][vc_column][vc_empty_space height=”60px”][/vc_column][/vc_row][vc_row inverse=”” el_class=”stats-trends” css=”.vc_custom_1576878966303{border-radius: 2px !important;}”][vc_column width=”1/2″ css=”.vc_custom_1576878906461{border-right-width: 0px !important;}”][vc_column_text]
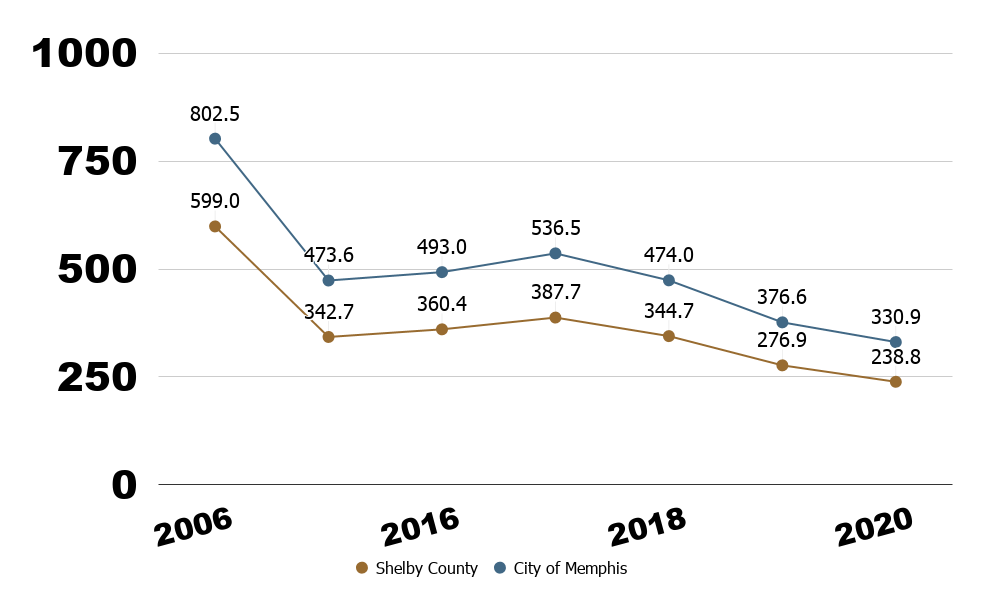
Reported Robberies
[/vc_column_text][cq_vc_modal buttontext=”JTNDaW1nJTIwY2xhc3MlM0QlMjJhbGlnbnJpZ2h0JTIwc2l6ZS1mdWxsJTIwd3AtaW1hZ2UtMTc4MSUyMiUyMHNyYyUzRCUyMmh0dHBzJTNBJTJGJTJGbWVtcGhpc2NyaW1lLm9yZyUyRndwLWNvbnRlbnQlMkZ1cGxvYWRzJTJGMjAyMSUyRjAzJTJGUm9iYmVyaWVzLnBuZyUyMiUyMGFsdCUzRCUyMiUyMiUyMHdpZHRoJTNEJTIyMTAyNCUyMiUyMGhlaWdodCUzRCUyMjYwMCUyMiUyMCUyRiUzRSUwQQ==” textcolor=”#333333″ background=”#ffffff”]Reported Robberies
(Incidents per 100,000 population)
 [/cq_vc_modal][/vc_column][vc_column width=”1/2″][vc_column_text]
Aggravated Assaults
[/vc_column_text][cq_vc_modal buttontext=”JTNDaW1nJTIwY2xhc3MlM0QlMjJhbGlnbnJpZ2h0JTIwc2l6ZS1mdWxsJTIwd3AtaW1hZ2UtMTc4MSUyMiUyMHNyYyUzRCUyMmh0dHBzJTNBJTJGJTJGbWVtcGhpc2NyaW1lLm9yZyUyRndwLWNvbnRlbnQlMkZ1cGxvYWRzJTJGMjAyMSUyRjAzJTJGQWdnQXNzYXVsdHMucG5nJTIyJTIwYWx0JTNEJTIyJTIyJTIwd2lkdGglM0QlMjIxMDI0JTIyJTIwaGVpZ2h0JTNEJTIyNjAwJTIyJTIwJTJGJTNF” textcolor=”#333333″ background=”#ffffff”]Aggravated Assaults
(Incidents per 100,000 population)
 [/cq_vc_modal][/vc_column][/vc_row][vc_row inverse=”” el_class=”stats-trends” css=”.vc_custom_1576878966303{border-radius: 2px !important;}”][vc_column width=”1/2″ css=”.vc_custom_1576878906461{border-right-width: 0px !important;}”][vc_column_text]
[/vc_column_text][/vc_column][vc_column width=”1/2″ css=”.vc_custom_1576879058114{padding-top: 30px !important;}”][vc_column_text]
[/vc_column_text][/vc_column][vc_column][vc_empty_space height=”60px”][/vc_column][/vc_row][vc_row full_width=”stretch_row_content_no_spaces”][vc_column width=”1/2″][vc_cta h2=”JOIN SAFE COMMUNITY” h2_font_container=”color:%23ffffff” h2_google_fonts=”font_family:Open%20Sans%3A300%2C300italic%2Cregular%2Citalic%2C600%2C600italic%2C700%2C700italic%2C800%2C800italic|font_style:800%20bold%20regular%3A800%3Anormal” txt_align=”center” shape=”square” style=”flat” color=”white” add_button=”bottom” btn_title=”Join Now” btn_style=”outline-custom” btn_outline_custom_color=”#ffffff” btn_outline_custom_hover_background=”#ffffff” btn_outline_custom_hover_text=”#4a7289″ btn_shape=”square” btn_size=”lg” btn_align=”center” btn_css_animation=”none” use_custom_fonts_h2=”true” css=”.vc_custom_1578809176597{padding-top: 200px !important;padding-bottom: 200px !important;background-image: url(https://memphiscrime.org/wp-content/uploads/2019/12/footer-left.jpg?id=1591) !important;background-position: center !important;background-repeat: no-repeat !important;background-size: cover !important;}” btn_link=”url:http%3A%2F%2Fmemphiscrime.org%2Fjoin-safe-community%2F|title:Join%20Safe%20Community||”][/vc_cta][/vc_column][vc_column width=”1/2″][vc_cta h2=”DONATE NOW” h2_font_container=”color:%23ffffff” h2_google_fonts=”font_family:Open%20Sans%3A300%2C300italic%2Cregular%2Citalic%2C600%2C600italic%2C700%2C700italic%2C800%2C800italic|font_style:800%20bold%20regular%3A800%3Anormal” txt_align=”center” shape=”square” style=”flat” color=”white” add_button=”bottom” btn_title=”Give Today” btn_style=”outline-custom” btn_outline_custom_color=”#ffffff” btn_outline_custom_hover_background=”#ffffff” btn_outline_custom_hover_text=”#4a7289″ btn_shape=”square” btn_size=”lg” btn_align=”center” use_custom_fonts_h2=”true” use_custom_fonts_h4=”true” css=”.vc_custom_1578809185322{padding-top: 200px !important;padding-bottom: 200px !important;background-image: url(https://memphiscrime.org/wp-content/uploads/2019/12/footer-right.jpg?id=1592) !important;background-position: center !important;background-repeat: no-repeat !important;background-size: cover !important;}” btn_link=”url:https%3A%2F%2Fsecure.givelively.org%2Fdonate%2Fmemphis-shelby-crime-commission|title:Donate|target:%20_blank|”][/vc_cta][/vc_column][/vc_row][vc_row][vc_column][vc_empty_space][vc_custom_heading text=”HOW ARE CRIME RATES CALCULATED?” font_container=”tag:h1|text_align:center” use_theme_fonts=”yes”][vc_empty_space][vc_column_text]We are asked from time to time how the crime rates released by the University of Memphis Public Safety Institute and the Memphis Shelby Crime Commission are calculated and why they sometimes differ from figures released by individual law enforcement agencies or the FBI. The following is a summary of our sources, the methodology used, offenses covered, and the definitions used.
Sources and Methodology
The sources of the crime rates issued by the University of Memphis Public Safety Institute and the Memphis Shelby Crime Commission are data submitted to the Tennessee Bureau of Investigation’s (TBI’s) Tennessee Incident-Based Reporting System (TIBRS) by individual law enforcement agencies (such as the Memphis Police Department, Shelby County Sheriff’s Office, Bartlett Police Department, and others). Sometimes, a local law enforcement agency may release crime figures that differ slightly from those released by the Public Safety Institute and the Crime Commission based on data submitted to the TBI. For their own internal purposes, some local law enforcement agencies track crime in a slightly different way. For example, the Memphis Police Department may release figures for “homicides” rather than “murders.” Not every homicide is a murder, as explained below. Also, for certain violent crimes such as aggravated assault, the Memphis Police Department tracks incidents while the TBI data is based on the number of victims, as set forth below. One incident can involve multiple victims.
The crime categories used by the TBI are designed generally to parallel the categories used by the FBI in its annual Nationwide Uniform Crime Report (UCR) to the extent possible, given differences in definitions used by TIBRS and the UCR for certain offenses. It is important to understand that both UCR and TIBRS data only represent crimes known to and reported by law enforcement.
Crime rates are calculated based on the number of crimes per 100,000 population.
U.S. Census Bureau 2019 population estimates were used to calculate the 2019 crime rates. Along with the rates per 100,000 population, the Public Safety Institute and the Crime Commission also release the raw crime numbers for various categories based on TBI figures.
TIBRS and UCR definitions are similar for many of the offenses. However, the definitions are not always exactly the same. For example, the UCR definition for “rape” prior to 2013 was more limited then that used by TIBRS. Therefore, TIBRS rape figures will normally be greater than the UCR figures reported prior to 2013.
When the actual reported numbers in a crime category or offense category are small, percent change may be misleading. For example, if the total number is 100, then each instance is equal to one percentage point; if the total number is ten, then each instance is equal to 10 percentage points. We suggest that percentages be viewed with caution when the sample size is less than 30 instances.
Offenses used in the reports
The FBI’s UCR includes only Part I Crime (also called Index Crime). Part I Crime includes murder and nonnegligent manslaughter, rape, robbery, aggravated assault, burglary, larceny (theft), motor vehicle theft, and arson. Because of limited participation and varying collection procedures by law enforcement agencies, only limited data are available for arson, and it was decided to not include arson data in calculations.
In addition to reporting on these individual categories, the Public Safety Institute and the Crime Commission report on composite categories called Major Violent Crime (made up of murders, rapes, robberies, and aggravated assaults) and Major Property Crime (made up of burglaries, auto thefts, and other felony theft offenses, or larcenies).
The UCR is a summary reporting system, using a hierarchy rule in which only the most serious offense is reported. On the other hand, TIBRS uses an approach in which all offenses are reported. TIBRS data, which is modeled upon the FBI’s National Incident Based Reporting System (NIBRS), allows for up to 10 offenses to be reported in a single incident, providing a more accurate picture of crime. (For example, under TIBRS, on incident involving a robbery and an aggravated assault would yield one robbery and one aggravated assault in the data). Further, TIBRS data for homicides, aggravated assault, and sex offenses are victim based. (For example, an aggravated assault with two victims would yield two aggravated assaults in the TIBRS data). Somewhat oddly, while robbery is counted as a violent crime in the UCR (as well as included in the Major Violent Crime category in the reports we release), it is treated as a property offense for TIBRS reporting purposes by law enforcement; therefore, under TIBRS, the offense of robbery is counted by occurrence and not the number of victims. For all those reasons, data in the TIBRS and UCR systems are not always the same. SINCE TIBRS (1) DOES NOT USE A HIERARCHY RULE AND (2) IS BASED ON THE NUMBER OF VICTIMS FOR CERTAIN TYPES OF OFFENSES, OFFENSE COUNTS BETWEEN TIBRS AND THE UCR DO VARY. Generally, TIBRS figures will be higher.
Only about 15 states use crime data gathering systems modeled upon the FBI’s National Incident Based Reporting System (NIBRS), with Tennessee’s TIBRS system being one. In order not to penalize those states that are compliant with NIBRS, before issuing its annual Uniform Crime Report, the FBI converts NIBRS- compliant data to the UCR system by counting only the most serious offense in an incident. The FBI continues to urge all states to became NIBRS compliant, which would allow a more accurate picture of crime nationwide.
Another major difference between the two reporting systems is the degree of detail in reporting. Unlike the UCR summary system that collects data on only the eight crimes set forth above, TIBRS collects data on 24 crime categories made up of 54 specific crimes called Group A offenses. This allows the Public Safety Institute and the Crime Commission to report an overall crime rate and number.
Definitions used for certain crime categories
Murder and nonnegligent manslaughter include any willful (non-negligent), non-justifiable killing of one human being by another. Death caused by negligence, suicides, and accidental deaths are excluded. Justifiable homicides include those committed in self-defense and are not included.
Beginning in 2013, the UCR began using a broader definition of rape. In order to be compatible with the new rape definition used by the UCR, three TIBRS offenses are combined:
- Forcible rape
- Forcible sodomy
- Sexual assault with an object
Robbery includes taking or attempting to take anything of value under confrontational circumstances from the care, custody, or control of a person or persons by force or threat of force or violence and/or by putting the victim in fear.
Aggravated assault is an unlawful attack by one person upon another in which the offender uses a weapon on displays it in a threatening manner, or the victim suffers severe or aggravated bodily injury. Simple assaults are excluded.
Burglary is the unlawful entry of a structure to commit a felony or a theft.
Larceny (except motor vehicle theft, which is a separate category) is the unlawful taking, carrying, leading, or riding away of property from the possession or constructive possession of another. The larceny theft category is constructed by calculating a sum of the following TIBRS offenses:
- Pocket-picking
- Purse snatching
- Shoplifting
- Theft from building
- Theft from coin-operated machine or device
- Theft from motor vehicle
- Theft of motor vehicle parts or accessories
- All other larceny
In TIBRS, domestic violence offenses are drawn from incidents reported by law enforcement agencies. An incident is defined in TIBRS as “one or more offenses committed by the same offender, or group of offenders acting in concert, at the same time and place” based on the reported “victim to offender relationship.” The TBI has defined domestic violence offenses as those flagged by law enforcement as domestically related and have the individual victim type identified.
Since all of the domestic violence offenses are categorized as “crimes against persons,” TIBRS uses the National Incident-Based Reporting System approach by counting the number of victims involved in an incident, not incidents.
Unlike TIBRS, the UCR does not provide separate data for domestic violence offenses.
Total TIBRS Group A offenses involving firearms only cover the following crime categories: assault offenses, extortion/blackmail, homicide, human trafficking offenses, robbery, sex offenses, and weapon law violations. In these seven crime categories, offenses are included as involving a firearm when law enforcement indicates use of a firearm by an offender in the offense. Reported instances of stolen firearms are not included.
Using the TBI’s TIBRS system, the Public Safety Institute and the Crime Commission seek to release crime rates and numbers quarterly and annually for both Memphis and all of Shelby County.[/vc_column_text][vc_empty_space][/vc_column][/vc_row]